Introduction
- Dashboards display selected metrics of one or more entitie4s over a specific period of time
- Dashboards are the primary mechanizm for visualizing data sent to Zenoss Cloud through its data ingest API
- Collection Zones have their own dashboard feature, but do not have access to data received from the Zenoss Cloud API.
- There are several tile types, but we’ll focus on graphs.
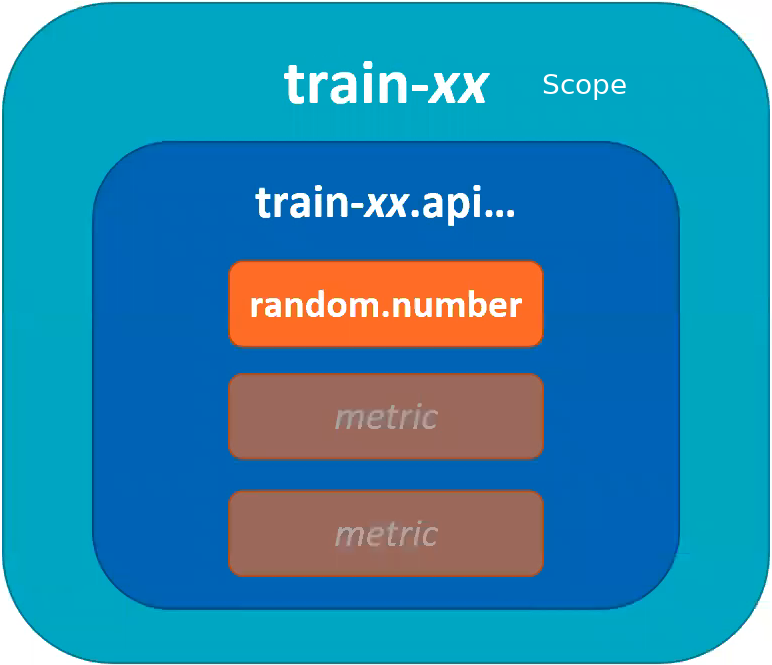
Scopes, Entities and Metrics
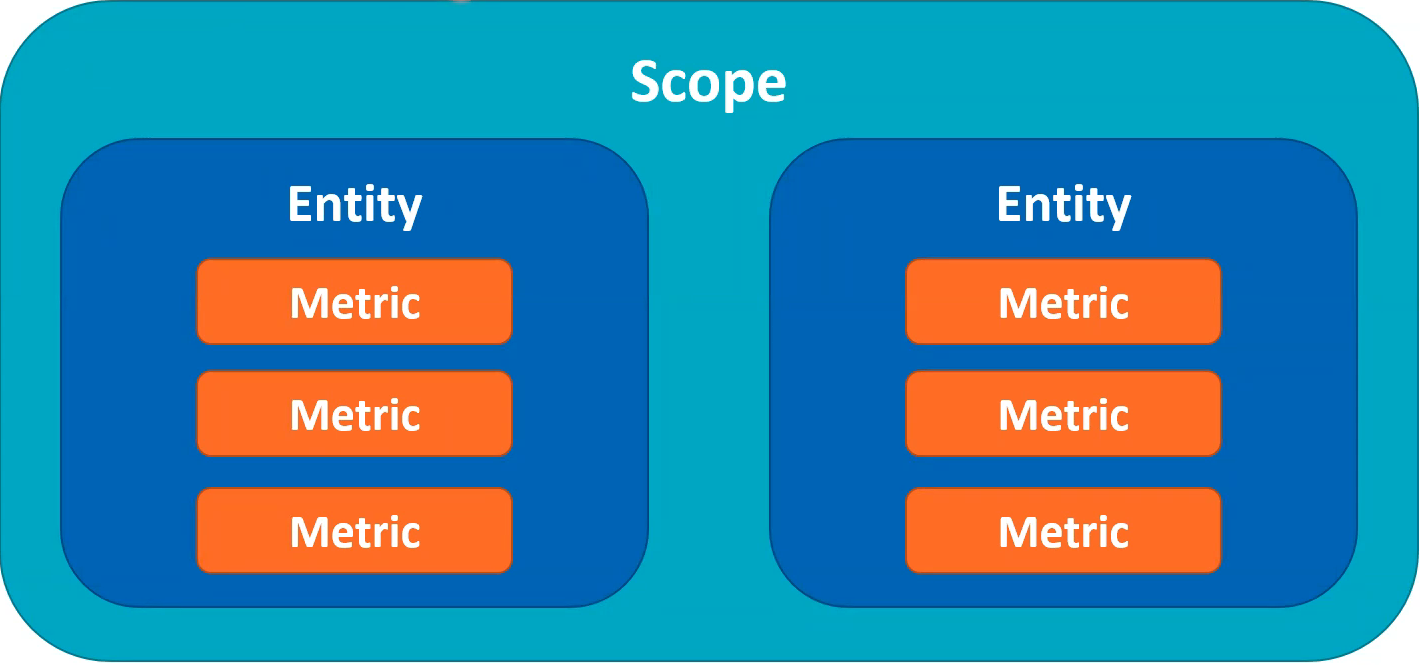
- Dashboards care about scope
- Things that get graphed are filtered by the scope of the dashboard.
- Dashboard will filter down all available entities to some subset of those entities.
Create a Dashboard
- Dashboards > Create a new dashboard
- Change the name of the dashboard
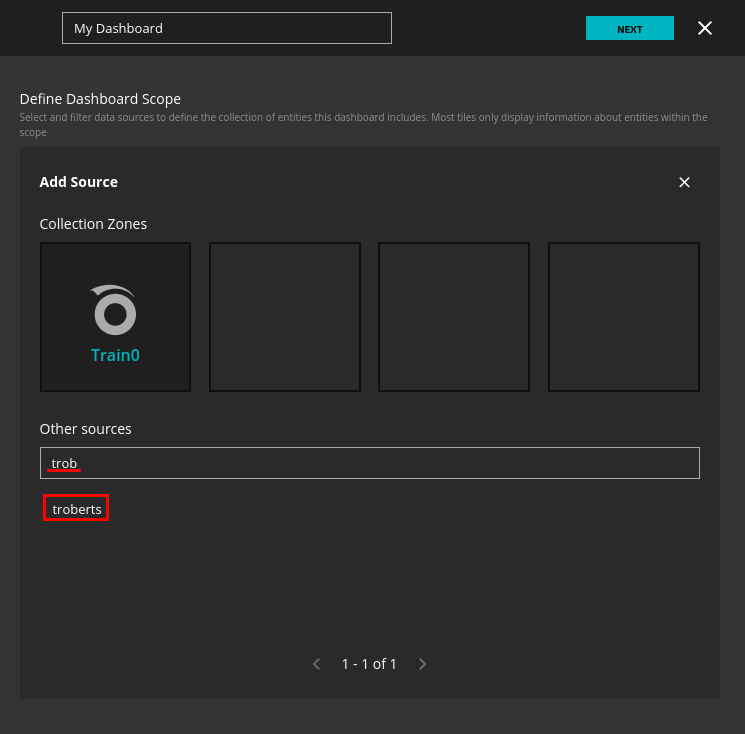
- Select Entities
- Streaming Entities are not associated with Collection Zones so do not select any.
- Instead, use “Other Sources” and start typing the name of your entity.
- Set Auto-Refresh
- Set Time Range
- Blue [Past 24 hours] button
- Select a preset
- Use the slider
- Customize as you desire.
Creating a graph
- Drag the graph tile onto the dashboard workspace.
- Position and size as required
- Name the widget as desired
- Select an entity and metric
- Start typing the name of the entity, then select with the mouse.
- Start typing the name of the metric, then select with the mouse.
- Add any additional Metrics
- Click the [Add New Metric] button
- Repeat adding the new entity and metric.
- Repeat as desired
- Save