6. Clone the demo app
- Go to: https://github.com/habmic/opentelemetry-101
- Clone the repo – giving a star never hurt 😉
- cd to opentelemetry-101
- run ‘git checkout 1’ – we use tags to jump to different stages of the project
- docker-compose up
8. Install OpenTelemetry
https://github.com/habmic/opentelemetry-101/blob/main/docs/installing-opentelemetry.md
Installing the libraries
yarn add @opentelemetry/api @opentelemetry/auto-instrumentations-node @opentelemetry/exporter-trace-otlp-proto @opentelemetry/sdk-node
Verify everything is working
todo service
Jaeger
9. How Distributed traces are made
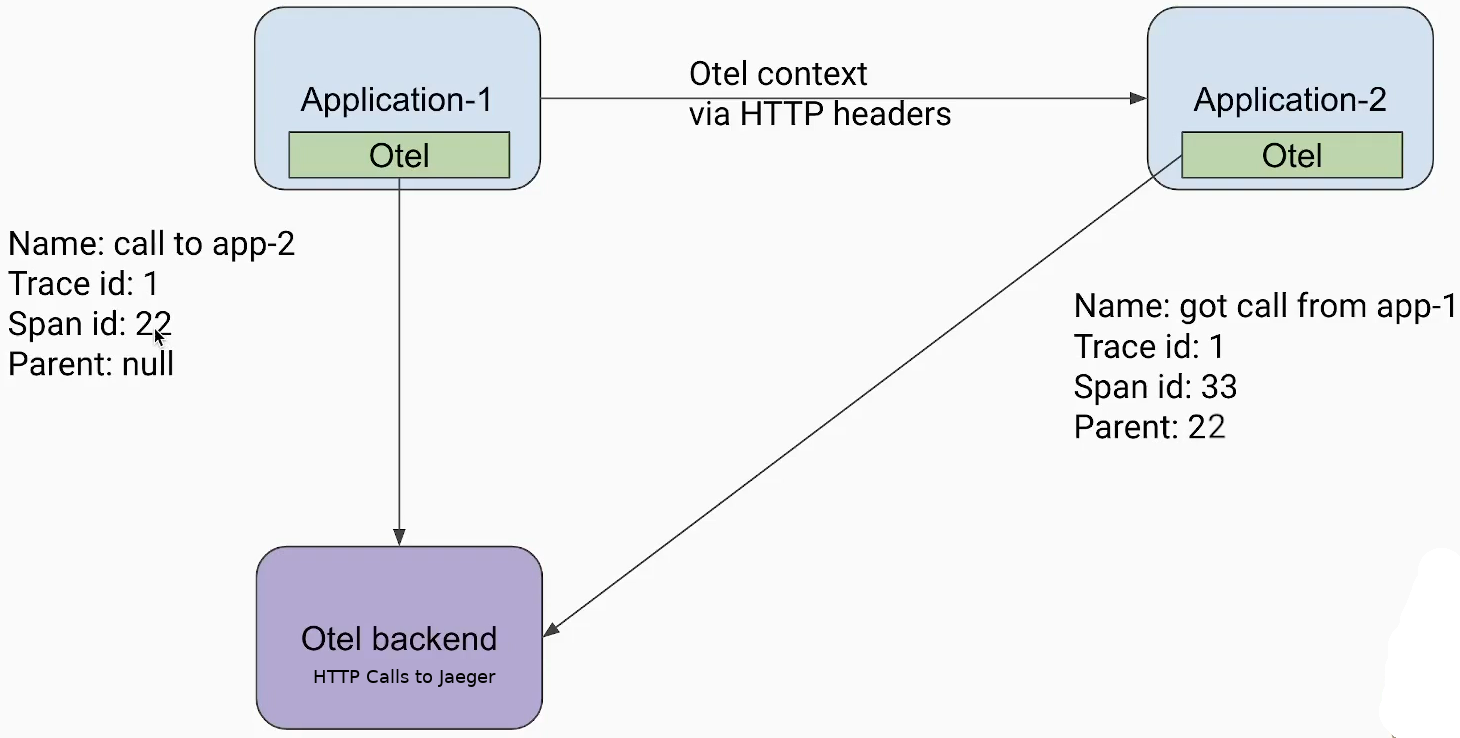
OpenTelemetry (OTEL) context is sent in HTTP headers
- Span ID
- Parent Span ID
- If not defined, then the root id is used
- Trace ID
10. Adding Metrics
Follow steps in the link below:
https://github.com/habmic/opentelemetry-101/blob/main/docs/adding-metrics.md
Notes:
– Add the ‘Running Prometheus’ code to the docker-compose.yml file and not prometheus.yml as hinted by the online doc!
– sleep command does not exist. Add the following line before app.get (all one line)
const sleep = (time: number) => { return new Promise((resolve) => { setTimeout(resolve, time) }) };
– fail fails! Something about cannot send headers after … (
if (req.query['fail']){
    console.error('Really bad error!');
    res.sendStatus(500);
    return;
}
Prometheus
- Prometheus is an open-source time-series database
- Also provided by the CNCF Cloud Native Computing Foundation
- Prometheus ‘scrapes’ for metrics.
- The targets are noted in the prometheus.yml file, hitting the source files on their assigned ports.
Verify
- API Calls
- Jaeger
- Prometheus
histogram_quantile(0.95, sum(rate(http_calls_bucket[1m])) by (le, route))
11. Correlating logs with traces
12. Creating manual spans
13. Creating span attributes (tags)
- Key: Value pairs
- Can be used to search in Jaeger
- Custom tags can be added
- i.e. User ID
opentelemetry.trace.getActiveSpan()?.setAttribute('userId',123);
opentelemetry.trace.getActiveSpan()?.setAttributes({'userId',123});