Source: https://www.youtube.com/watch?v=dfpGU9al_i4
Merger of 2 open source standards:
- Open Tracing
- Open Census
Types of data
Tracing
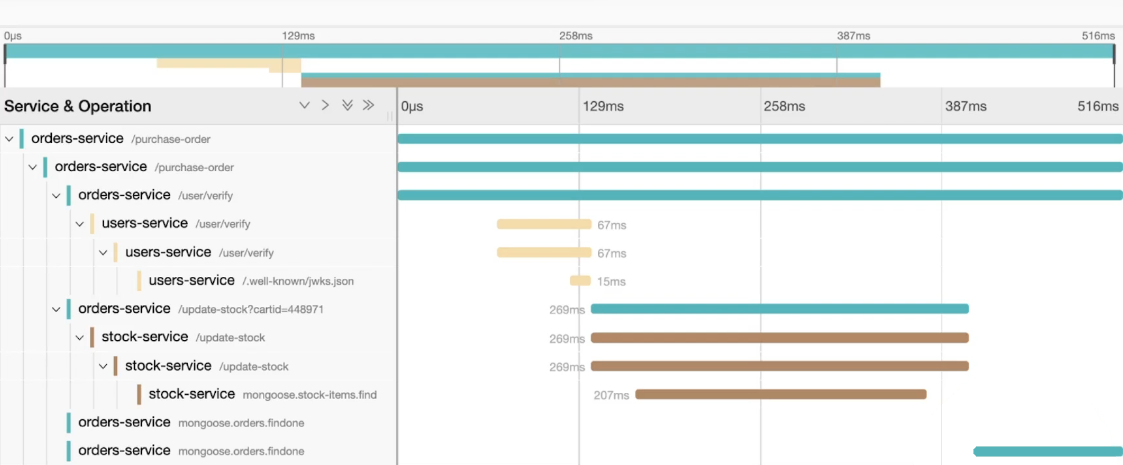
- Made of spans.
- Spans represent the work being done by a sub-component of a service.
- Name
- Start timestamp
- End timestamp
- Attributes
- These are predefined depending on the technology
- Http:
- http.method
- http.status_code
- Database
- db.type
- db.instance
- db.statement
- Messaging
- messaging.system
- messaging.destination
- Http:
- These are predefined depending on the technology
Metrics
- A measurement of something
- Name
- Description
- Unit
- Kind
- There are 3 “kinds” of metrics
- counter: Increments over time
- metric: aggregation of a value over time
- observer: set of values at a given time
- There are 3 “kinds” of metrics
- Label
- Aggregation
- Timestamp
Logs
- Video is old. Logging is available now.
OTel Components
Collectors
- May not be required
- Can make deployment faster/easier
- Deployment Options
- Agent
- Containerized
- Daemon set
- Gateway
- Multiple collectors running as a service
- Point your collectors to this then export to a common source.
Collector Components
- Receiver
- Get the data to the collector
- Push or Pull
- otlp protocols
- grpc
- Specify endpoint:
- endpoint: 0.0.0.0.:55680
- http (otlphttp = protobuf)
- Specify endpoint
- endpoint: 0.0.0.0:55681
- grpc
- Processor
- Transform the data you’ve received
- Exporter
- Where to send the data
- Can send to multiple locations
- Where to send the data
Collector Pipelines
- Really just the YAML file
Extensions
- Trace Extensions
- Receiver . Exporter
- OTLP
- Jaeger
- Zipkin
- Processor
- Attributes
- batch
- queued retry
- resource
- sampling
- span
- Receiver . Exporter
- Metric Extensions
- Receiver
- OTLP
- Host
- Promethius
- Exporter
- OTLP
- Prometheus
- Receiver
- Community Based
- Build Your Own extensions
- Enhance the collector pipeline
- Perhaps build a dedicated exporter
Client Library (Instrumentation Library)
- Applications require an instrumentation library (manual or automatic)
- Automatic
- Various languages supported
- Natively supported language list
- Manual
- You have to do all of this.