Section 7: Execution Plan of BigQuery
31. How BQ creates execution plan of a query
- How does BQ decide what order to process query statements
- What processes need to be performed before others
- What processes can be ran in parallel
- This is similar to EXPLAIN statements
Example:
This query calculates the total scores of all employee ids present in both tables
select c.id, max(c.scores) as scr from (
  select id, name from emp_table as emp
  INNER JOIN (select id, scores from score_table) as scr
  ON emp_id = scr.id
) as c
GROUP BY id
Steps
- Select required data from emp_table
- Select from score_table
- Join them together and aggregate the data
Optimized Execution Plan
- Run steps 1 and 2 in parallel
- Run step 3
How
- Steps communicate using in-memory shuffle architecture
- BQ executes all queries completely in memory
- Shuffle is a key ingredient
- required for execution of large and complex joins, aggregations and analytic operations
- Traditional distributed processing systems, such as MapReduce in (and?) Hadoop
- Various mappers output was shuffled across nodes and placed under 1 node where the reduce step is executed.
- Shuffling requires a lot of disk R/W operations while consuming a lot of network bandwidth so it is slow and can be a bottleneck
- The solution to this is in-memory shuffling
- BQ stores intermediate data produced from various stages of query processing in memory in a set of nodes that are dedicated to hosting remote memory
- This idea is not new and is common in many systems
- BQ also uses memory for shuffle and repartitioning operations
- This is different from MapReduce styles for shuffle
- In MapReduce style shuffles, the rows in the repartitioned data can only be used after all rows have been shuffled and sorted
- In BQ, each shuffled row can be consumed by BQ workers as soon as it is created by the producers.
- This makes it possible to execute distributed operations in a pipeline.
- This is different from MapReduce styles for shuffle
- BQ breaks the declarative SQL statement into granular sets of stages and designs an optimized graph of execution.
- This is dynamic and can be modified while the query is in flight.
- new stages can be introduced while a query is running
- These stages are typically labeled Repartition stages
Viewing the query plan
- Run a query
- Click the Executive Details option
Deep Dive 5:00
There is a LOT of good information here. Recommend revisiting
- Elapsed time = total execution time
- Slots required
- Slots run in parallel
- Think of slots as tiny processors, memory and IO
- Bytes shuffled, lower the better
- Bytes to disk = overflow
32. Understanding Execution Plan in UI Dashboard
https://www.udemy.com/course/bigquery/learn/lecture/22742749#questions
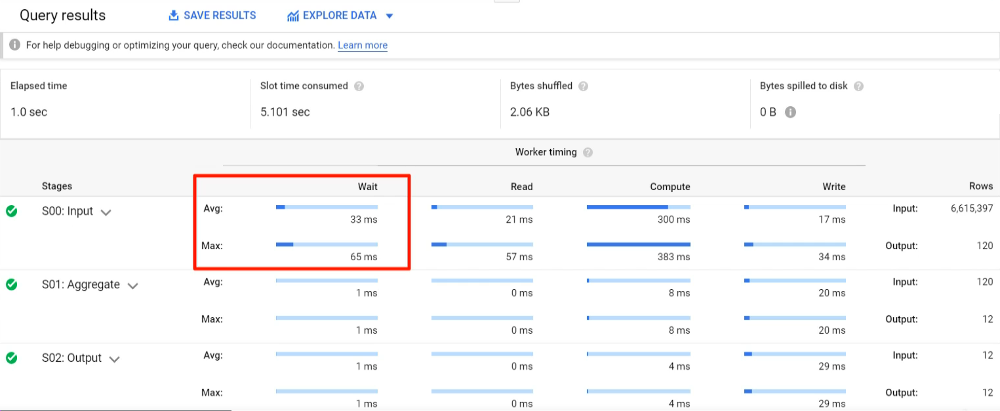
- Many stages can be processed in parallel
- Some stages have to wait for others to complete before they can start.
- At each stage, workers spend their time in various actions, read, write, compute, etc.
- Can view the average time and long-tail slowest worker performance for a given classification
- Ave and Max further broken down into Absolute and Relative representations
- UI shows Relative
- If Average and Max are the same, stage was only using 1 worker.
- Wait
- Waiting for IO access to source
- Waiting for another stage
- Read
- Includes filtering
- Compute
- Combines Compute and Aggregate
- Compute example: round(divide(multiply(subtract($2,32),5),9),1)
- Aggregate does grouping operations
- Write
- Output operations
- The Execution Plan can help you understand which stages are dominating the resource utilization
- JOIN stage generating far more output rows than input
- This would indicate an opportunity to apply a filter before the join
- By viewing the number of bytes, you can identify if the data is getting skewed somewhere.
- Good for troubleshooting
- Queries can fail mid-execution
- Use this to identify at which stage the failure occurred.
- JOIN stage generating far more output rows than input