Resources
- Streaming Data Policy
- Day 1: s3.us-east-2.amazonaws.com/s3.thomasandsofia.com/zenoss/training/streaming-data/20210303-Streaming_Data_to_Zenoss_Cloud-D1.mp4
- Day 2: s3.us-east-2.amazonaws.com/s3.thomasandsofia.com/zenoss/training/streaming-data/20210304-Streaming_Data_to_Zenoss_Cloud-D2.mp4
Day 1
Why Stream Data
- Short lived applications or services (docker containers)
- Container based services
- Microservices
- Serverless functions
- Need to Push data from application or service vs. having them Pulled
- Data that is not exactly “Metrics” but want displayed on a dashboard
- Business or Costs data
- Events
Streaming Data Exporters and Agents
0:05:00
- OpenCensus
- Set of libraries in multiple languages that collect application metrics and transfer to backend of your choice.
- Zenoss provides OC exporters for Go, JavaScript and Python
- Prometheus
- Requires the Zenoss Agent that acts as a remote database for Prometheus data.
- Agent converts data to metric and model data then streams to Zenoss Cloud
- Agent is deployed into a Kubernetes cluster as a Helm chart packaging method
- StatsD
- Is both simple protocol and set of software tools to collect, aggregate and publish metrics as defined by your application.
- Written in Go
- Support for many languages
- Application needs to support the protocol
- Zenoss Docs: https://help.zenoss.com/docs/streaming-data-to-zenoss-cloud/using-a-statsd-agent-to-stream-data

- Grow your own
- Can create an agent or enable an application to send metrics directly to Zenoss cloud in any language that supports creating a secure connection to the API server using HTTPS
- We’ll demonstrate using shell scripts and Python programs
Zenoss API Keys
0:10:00
- Login: https://train.zenoss.io
- Streaming Data keys enable agents and applications to publish data directly to the Zenoss Cloud.
- Data pushed to cloud. mono-directional
- Collection Zone keys enable you to automate tasks using the Collection Zone JSON API
- Uses Routers and Methods to perform management functions. bi-directional
- Add devices, users, change properties, etc.
- Uses Routers and Methods to perform management functions. bi-directional
- Must have Manager or Key Administrator roles to generate Streaming Data API keys
- https://help.zenoss.com/doxs/administering-zenoss-cloud/enabling-user-access/roles-and-permissions
- API keys are grouped by client
- Client is an organizing structure
- For Streaming Data API keys, specify the client name (often the platform or application being monitored) but can be any string.
- Each client may have multiple API keys
- Example: A given set of microservices that handle online processing, you might create a clinet named “Order Processing” and create an API key for each microservice.
- API Keys provide separate credentials for each user, service or function in a client environment.
- Using separate keys allows you to delete a key for a specific service that has been decommissioned, compromised, etc. without affecting the other services under that client.
Creating the API Client
- Zenoss Cloud > Admin > API Clients > [ + ADD CLIENT ]
- mYz3n0s%_fAk3ApIk3Yg035h3Re_d0noTfoRGeT
- Once a key is generated, the user must save. Zenoss does not save the key after it has been displayed.
Using the Zenoss Cloud API
- Uses HTTPS (Port 443 must be open outbound)
- Requires a valid APO key to be included in the HTTP headers
- “zenoss-api-key:mYz3n0s%_fAk3ApIk3Yg035h3Re_d0noTfoRGeT
- All incoming requests are sent to the same endpoint
- https://api.zenoss.io/
- The API key identifies the Zenoss Cloud instance where the key was generated.
- This eliminates the need for a separate API URL per organization
- Expects the body of the request to be in JSON format
API URLs
- Depending on the operation, the full path will vary
- Model data: https://api.zenoss.ip/v1/data-receiver/models
- Receives model data
- Metric data: https://api.zenoss.ip/v1/data-receiver/metrics
- Receives metric data
- Data Dictionary: https://api.zenoss.ip/v1/dictionary/metrics
- Sends and Receives metric dictionary data
- Model data: https://api.zenoss.ip/v1/data-receiver/models
- The HTTP request method (verb) may vary
- Model and Metric data use POST
- Data Dictionary methods may use GET, POST, PATCH or DELETE
Models and Metrics, Dimensions and Metadata
0:37:00
Models and Entities
Official Entities Documentation: https://docs.zenoss.io/api/receiver/understanding-entities.html#reserved-keys
- Entities define the source of Metrics
- Before data can be sent, the data needs to be associated to an Entity
- This requirement will eventually be removed.
- Entities include
- Devices
- Containers
- Applications, Services and Microservices
- Kubernetes clusters, namespaces, nodes and pods
- Entities are defined by their Model
- Models define the characteristics of an Entity
- Typically, streaming agents will publish their models at start up then publish their metrics on regular polling cycles (60 seconds for example)
Dimensions
- Required for models and metrics
- Provide context for, describe, or vategorize a model or metric
- Consist of a set of one or more name-value pairs
   "dimensions": {
      "source": "zennycorp.com",
      "source-host": "web-02.zennycorp.com",
      "source-type": "com.zenoss.training"
   }
- If there is no matching policy, a metric is associated with an entity only if its dimensions fields exactly match the dimensions fields of the entity’s model.
- Dimensions fields should be thought of an invariant. If they are changed, the resulting model or metric then refers to a different entity.
- You may use any dimension field names you wish to define your entity, as long an any metrics you send have the same exact dimension field names.
Models – Metrics example
Models
{
 "models": [
  {
   "timestamp": 1593883448000,
   "dimensions": {
    "source": "zennycorp.com",
    "source-host": "web-02.zennycorp.com",
    "source-type": "com.zenoss.training"
   },
   "metadataFields": {
    "name": "web-02.zennycorp.com"
   }
  }
 ]
}
Metrics
{
 "metrics": [
  {
   "metric": "resources_load_ave_5min",
   "timestamp": 1593883448000,
   "value": 4.03,
   "dimensions": {
    "source": "zennycorp.com",
    "source-host": "web-02.zennycorp.com",
    "source-type": "com.zenoss.training"
   }
  }
 ]
}
Dimensions Fields
source
- The “source” field groups entities and metrics together for display in Zenoss Cloud dashboards
- When you create a dashboard, you select one or more source values. Entities that match one of those values become the scope for that dashboard.
- Only metrics belonging to entities within a dashboard’s scope are available to that dashboard’s tiles.
- Note: The “source” field can either be a dimension or part of the metadata.
source-type
- Identifies the general type of data of the models and metrics in which it appears. This is often the name of the agent generating the data
- Example: The Zenoss Cloud Kubernetes agent specifies a source type of “zenoss.agent.kubernetes”
- The source field can be thought of an in instance of the source-type
- Example: The Zenoss Cloud Kubernetes agent uses the cluster name as the value for the source.
- source-type can be either a dimensions or metadata field.
Using Multiple Metrics example
Same dimension (same model), multiple metrics.
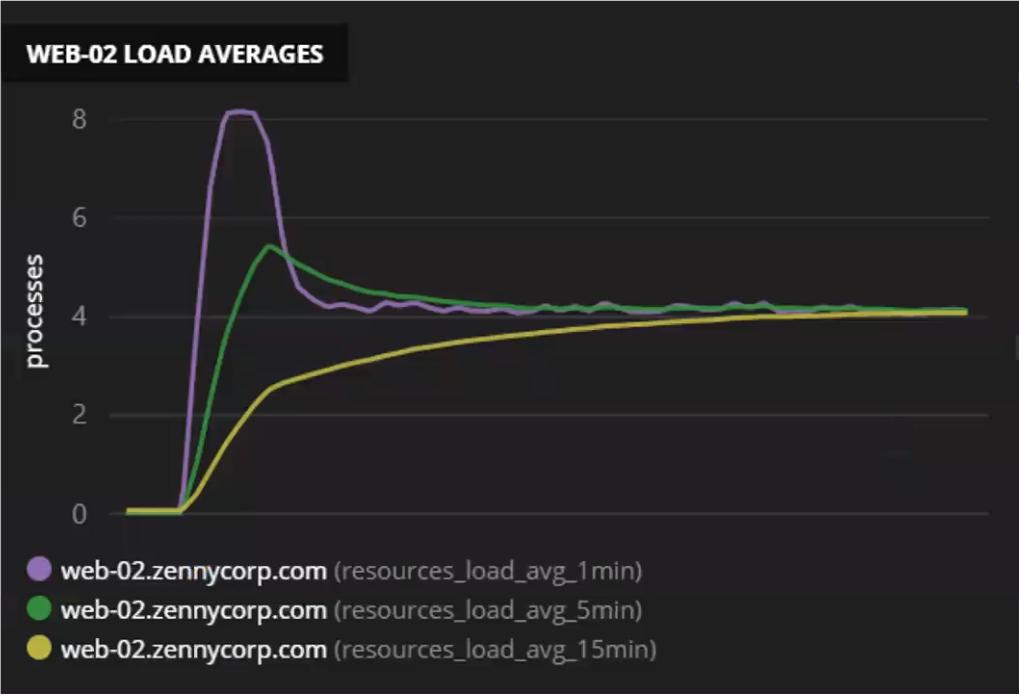
- Metric name changes (yellow)
- Dimensions fields stay the same (blue)
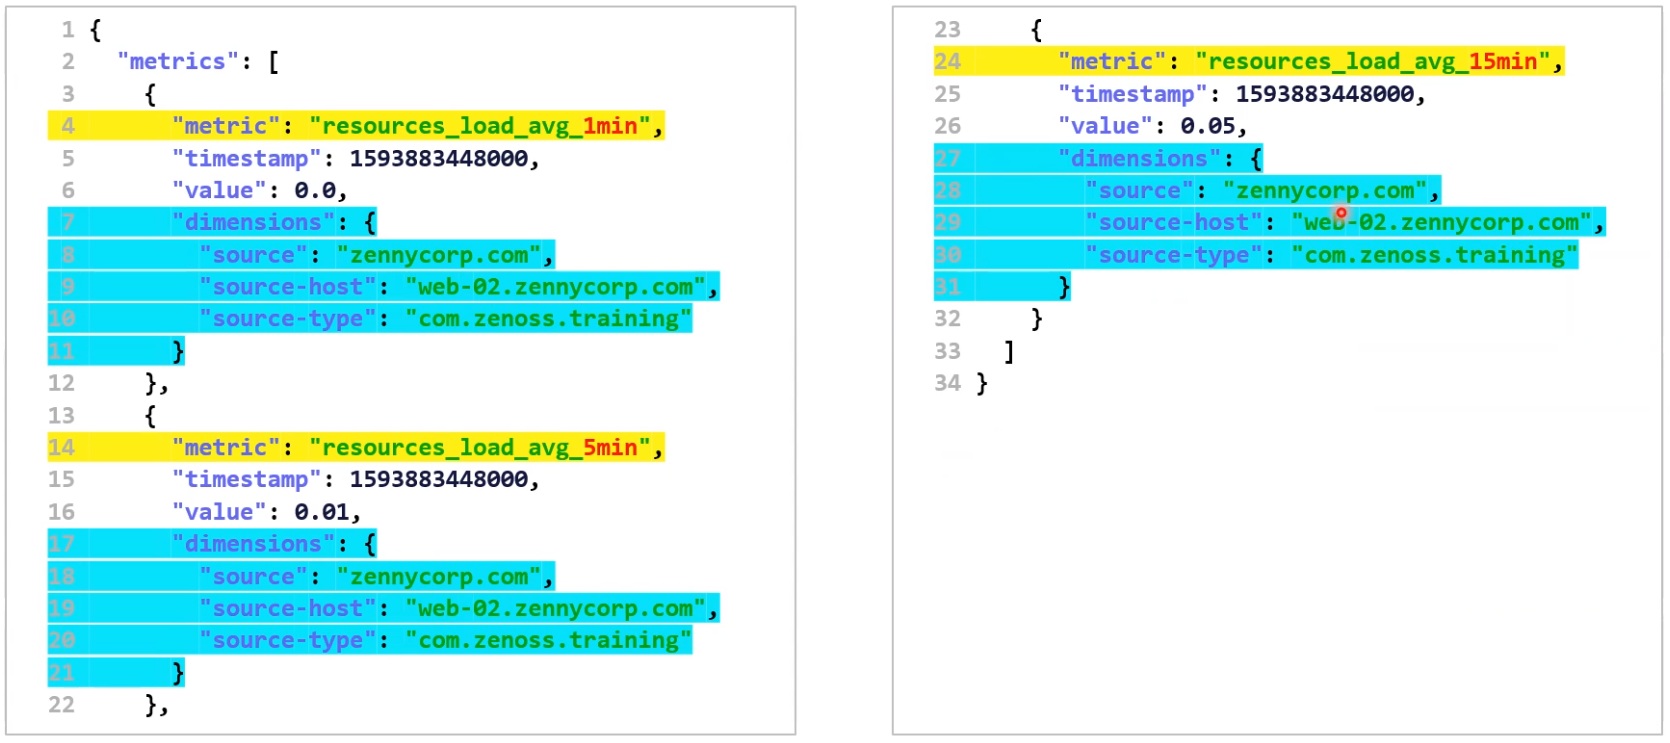
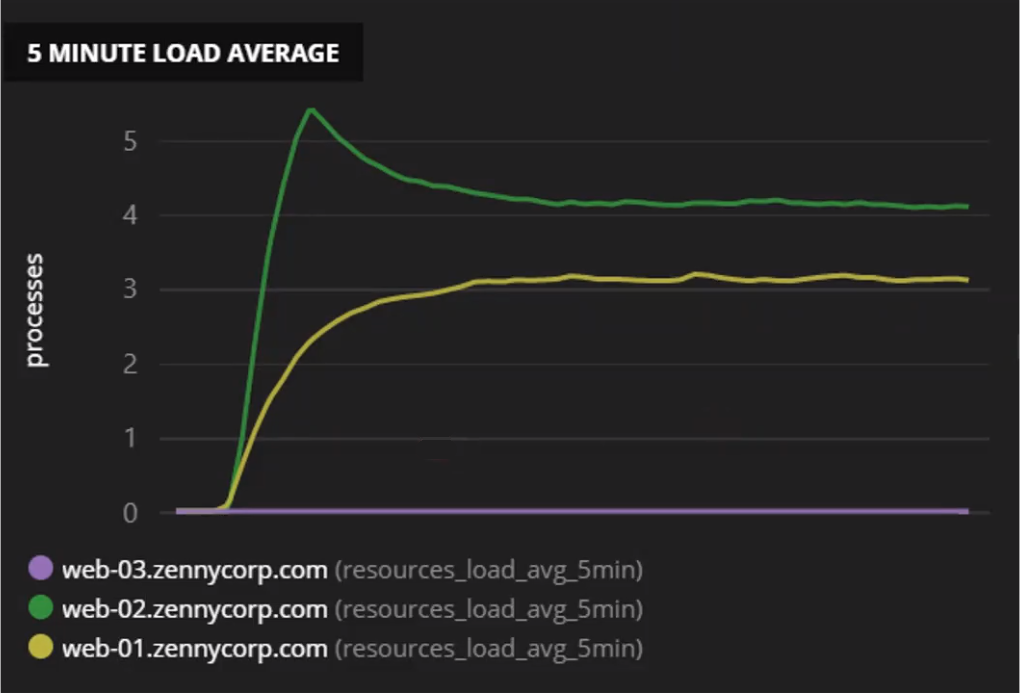
Same Metric, multiple Entities
- Metric name stays the same (yellow)
- Different Metric Values
- Different Dimensions (blue)

Metadata Fields
0:50:00
- Metadata consists of any additional model or metric fields that are not dimensions. These are attributes that are not required to uniquely identify the model or metric.
- The Model should always include a name metadata field. Think of it as the title or label for the entity the model describes
- Metadata fields may change over time
- If the source field is not required for uniqueness, it can be specified as a metadata field instead of a dimension field.
Model Fields
0:54:00
- timestamp (required): The date and time the model was generated as milliseconds since the epoch (Jan. 1, 1970 at 00:00:00 UTC)
- dimensions (required): A set of name-value pairs that define the entity represended by the model.
- metadataFields (required): A set of name-value pairs that provide additional information about the entity.
- The name metadata field should always be present.
Metric Fields
- timestamp (required)
- metric (required): Name of the metric
- value (required): Value of the metric. MUST BE NUMERIC
- dimensions (required)
- metadataFields (Not required)
Sending Data to the API
Personal note: Working from my user folder on cloudse
0:57:00
Getting setup in PuTTY
who cares
Using Linux
- Use
JSON Overview
1:08:00
- Easy for humans to read and write
- Easy for machines to parse
- “Name” and “Strings” must be wrapped in double quotes.
- Arrays: [ value1, “value2”, value3]
- Numbers: Integers, floats, E-Notation
- true, false, null: Must all be written in lower case.
- Anything within curly brackets is an Object.
- Objects may contain
- lists []
- dictionaries {“name1”: value1, “name2”: “value2”}
- Other objects
- Objects may contain
Anatomy of an API Call
- Host: api.zenoss.io
- Verb (-? ): POST, GET, etc.
- content-type: application/json
- zenoss-api-key: y0urZ3n0ssApiKeyH3r3
- Data (-d ): JSON wrapped in single quotes so Names and Strings can be in double.
- if call is successful, returns 200
Using the API key with Linux
- Copy the key to ~/.zenoss.key
chmod 600 ~/.zenoss.key
Get the Date
TIME_NOW_MS=$(date +%s000)
Using Bash and Curl
Creating a Simple JSON Model File (Exercise 6.4a & b)
cat > simple-model.json << EoT
{
  "models": [
    {
      "timestamp": $(date +s000),
      "dimensions": {
        "source": "$USER",
        "source-type": "com.zenoss.training"
      },
      "metadataFields": {
        "name": "${USER}-$(hostname -f)"
      }
    }
  ]
}
EoT
Curl – Client URL
curl -s -S https://api.zenoss.io/v1/data-receiver/models \
  -H "content-type: application/json" \
  -H "zenoss-api-key: $(cat ~/.zenoss.key)" \
  -X POST \
  -d @simple-model.json
- -s : Silent, no progress meter or error messages
- -S : Show error, use with -s
- URL : target URL
- -H : Header. Can be used multiple times
-H "content-type: application/json"-H "zenoss-api-key: $(cat ~/.zenoss.key)"
- -X : Request method (verb)
-X POST-X GET- -d : Data
'{ "here": "is some content" }'@use_this_file
JQ – JSON Query
- Not required but provides pretty printing
- Not installed by default
- Good for redirecting CURL outputs
curl .... | jq
HTTPie Utility
- Easy version of curl using Python
- Install via PIP
- Additional headers are just key:value pairs
- -b hides return headers and only displays the body of the message.
- Automatically assumes
content-type:application\json-X POST
- Automatically formats the output (jq not required)
- Example
https -b api.zenoss.io/v1/data-receiver/models "zenoss-api-key:$(cat key.file)" < data.json
Shortcuts
- Can use
:forlocalhost:
Scripting
1:46:00
- example.sh
- example_new.sh
watch -n 30 ./example.sh
Visualizing Streaming Data using Zenoss Cloud Dashboards
2:00:00
Overview
- A Dashboard displays selected metrics of one or more entities over a specific period of time
- Dashboards are the primary mechanism for visualizing data sent to Zenoss Cloud through its data ingest API
- Another tool is the Zenoss Cloud Smart View feature, which will be discussed later.
- Collection Zones also have dashboards but they do not have access to streaming data.
- Dashboards are built from customizable tiles
- Zenoss provides a set of different tile types which allow you to choose the most appropriate visualization to display your data.
Scope, Entities and Metrics
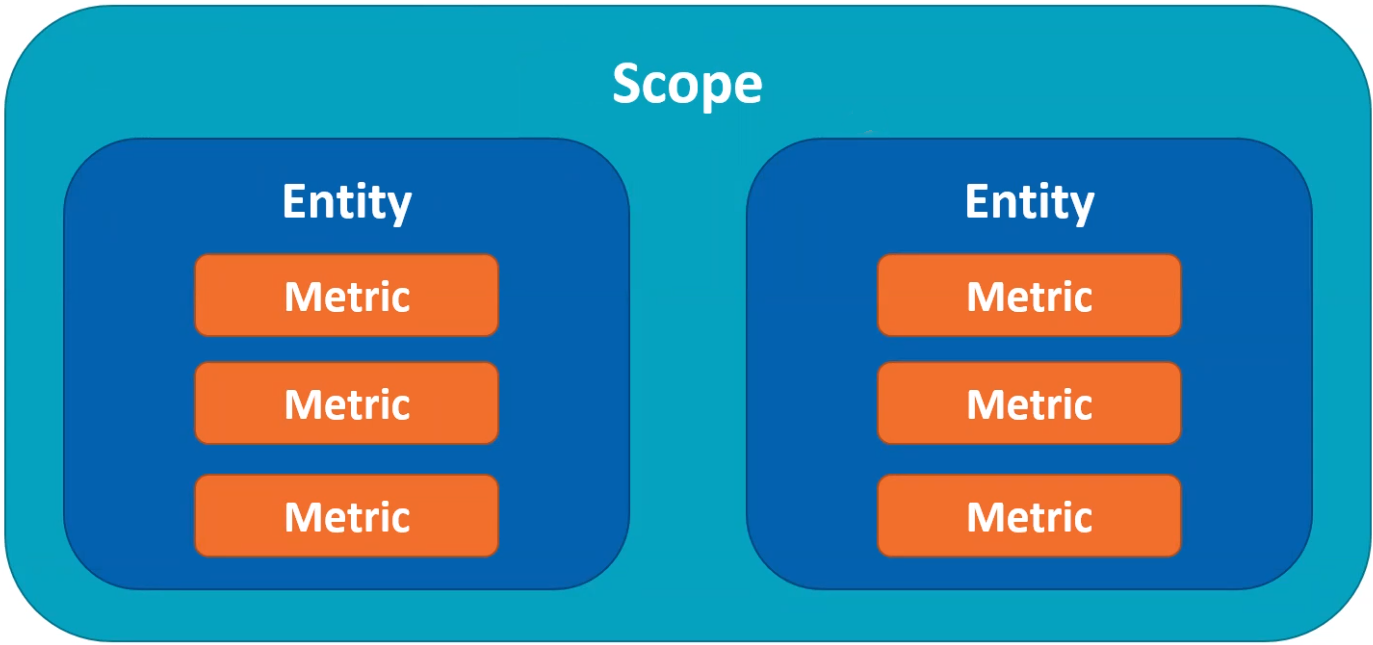
- Information available to a dashboard is determined by the dashboard’s scope.
- The scope is a filter that limits the available data to a set of Entities.
- Each Entity may have one or more metrics associated with it.
Creating a Dashboard
- Log into the cloud account used to create the API key earlier.
- Dashboards > Create New
- Add Entities > Search for the name used for the ‘source’ field
- This defaults to the username in the example scripts.
- Click the `✓` > Next
- Provide a new name > Save
Configuring a Dashboard.
- Enable Auto Refresh
- Select 1H to display results received over the past hour.
Adding a Graph Tile
- Click the pencil icon to edit the dashboard
- Select the graph tile from the Available Tiles box
- Change the Tile Title to “Random Number”
- In the Entity and metric search box:
- Enter the “name” of the entity you created and select.
- This did not work for a single entity. It only let me select the metric.
- Enter
randand select random.number as your metric
- Enter the “name” of the entity you created and select.
Sending Data Using Python
2:19:00