Service Impact
To Do
- Understand Process Sets
- Monitor II
Resources
- Lab
- https://zenoss5.train1.zenoss.com
- training:Z…123
- Video: https://s3.us-east-2.amazonaws.com/s3.thomasandsofia.com/zenoss/training/service-impact/20200528-Zenoss_Service_Impact.mp4
- Training Slides
- Exercise Guide
What is Service Impact (Impact for short)
- Resource Manager tells you what happened
- Impact tells you why you should care
- By building an Impact Service, you can tell what effect an event is going to have on a service downstream.
Benefits
- Constantly updated service events / status
- Automated root cause analysis
- Enhanced event management
- If a member of a service has an event, an event is also generated for the service.
/Service/event class
- By creating triggers and notifications only on Dynamic Services, you will reduce the amount of event “noise”
- If a member of a service has an event, an event is also generated for the service.
How it works
- Based on devices in Resource Manager and events generated by these devices.
- Adds 2 new services
- Impact:
- State propagation
- provides service alerting and root cause analysis
- zenimpactstate:
- Performs state calculations and event filtering for the Impact service.
- Add Graph Database
- All devices in the Object Database are copied/replicated into the Graph database.
- Add relationships between service elements and the state of each element
- Built for speed. Does not bog down the object database.
- Impact:
How the Graph database works
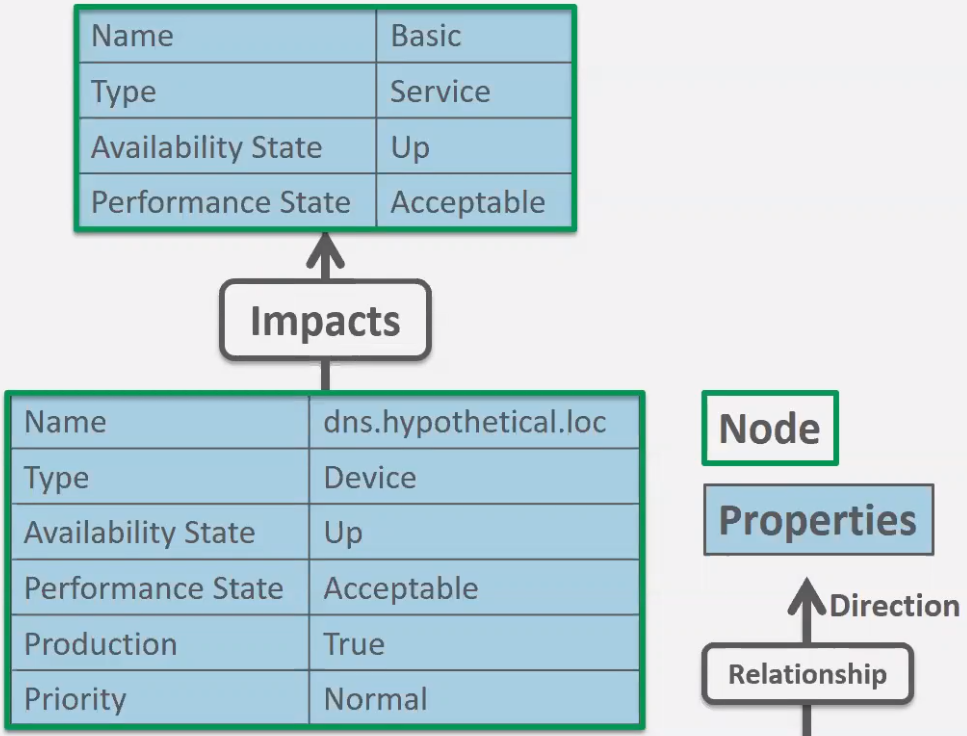
- Services are built on Members (aka Nodes in the database).
- Nodes have properties
- Node type : Service, Device, etc.
- Availability State
- Performance State
- Production State …
- Nodes have properties
- Relationships bubble up. Underlying events bubble to higher (Parent Nodes) to the top node.
Service States (aka Impact Types) and State Mappings
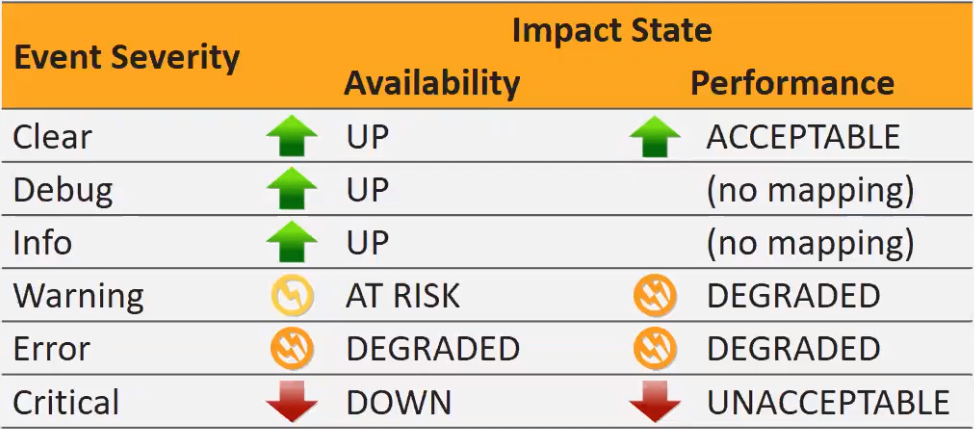
- Two Impact Types – Availability and Performance
- Availability Health
- Up (Clear, Debug, Info)
- At Risk (Warning)
- Degraded (Error)
- Down (Critical)
- Performance Health
- Acceptable (Clear)
- Degraded (Warning, Error)
- Unacceptable (Critical)
- Availability Health
- Type of Impact is determined by an event’s Event Class
- Anything with
/Status/will be categorized under Availability - Anything with
/Perf/will be categorized under Performance
- Anything with
- The State of the impacted element is derive3d from the Event Severity
- It is Important that template Thresholds are configured accurately.
- If Thresholds are too broad or too narrow, the Impact State will be inaccurate.
- By default, a Service’s state is the most severe state of any of its constituent members.
Building Services
- A Dynamic Service is a collection of Members.
- Service members may consist of
- Devices
- Components
- When adding a component, you get the rest of the device as a dependent part / related member of that service
- Other Services
- Logical Nodes
Events
- When an event occurs on a Member, an event will also be generated against the Service’s Availability or Performance.
- Events are ‘scored’ with a Confidence value which will show which event is most likely to cause the problem.
- Generally, the farther down in the chain an event occurs, the higher the confidence score will be.
- If a database is down, and that database is built on a VM that is also down, we should probably spend our time looking into the VM.
- 58:00
Server Component Monitoring
1:07:00
Process Monitoring
1:19:00
Application Monitoring
1:39:00
Other Dynamic Services
1:46:00
Building services out of services.
Monitoring WebSites
2:21:00
Creating “dummy devices”
- Do not have an IP Address
- Do not have a default monitoring template
- Names do not resolve in DNS
- site-blog.domain.tld
- Use Custom Properties to add the IP address
- Add required local copies of the required monitoring templates
- Edit the template to use the cProp vs. zProp.
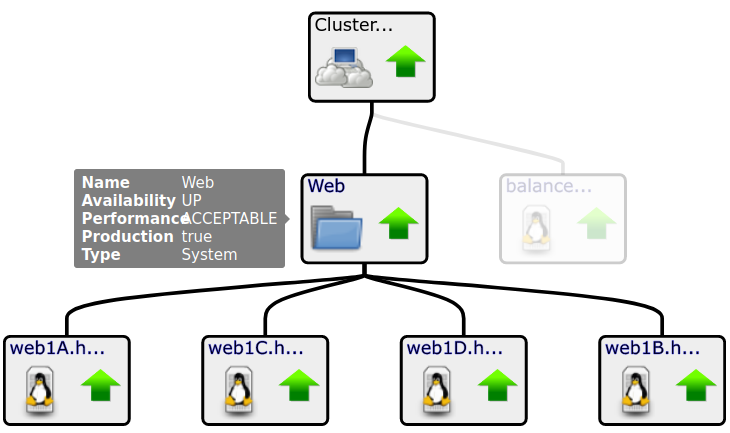
Navigating Impact View
- Right click on a node to see Child Services
- Right click on the white space for Show All
Root Cause Analysis & Confidence Scores
2:39:00
- Visible only in the Impact Events view
- Use the Confidence scores. Highest score likely your root cause.
- Rating auto-magically applies.
- Down (Critical) will rank higher than Degraded or At Risk
- This can be altered by creating a Service Policy. See below
- The lower in the chain (closer to the hardware, sort of) will often rank higher than events higher up.
- Down (Critical) will rank higher than Degraded or At Risk
Synthetic Web Transactions using Twill
2:42:00
Logical Nodes
2:46:00
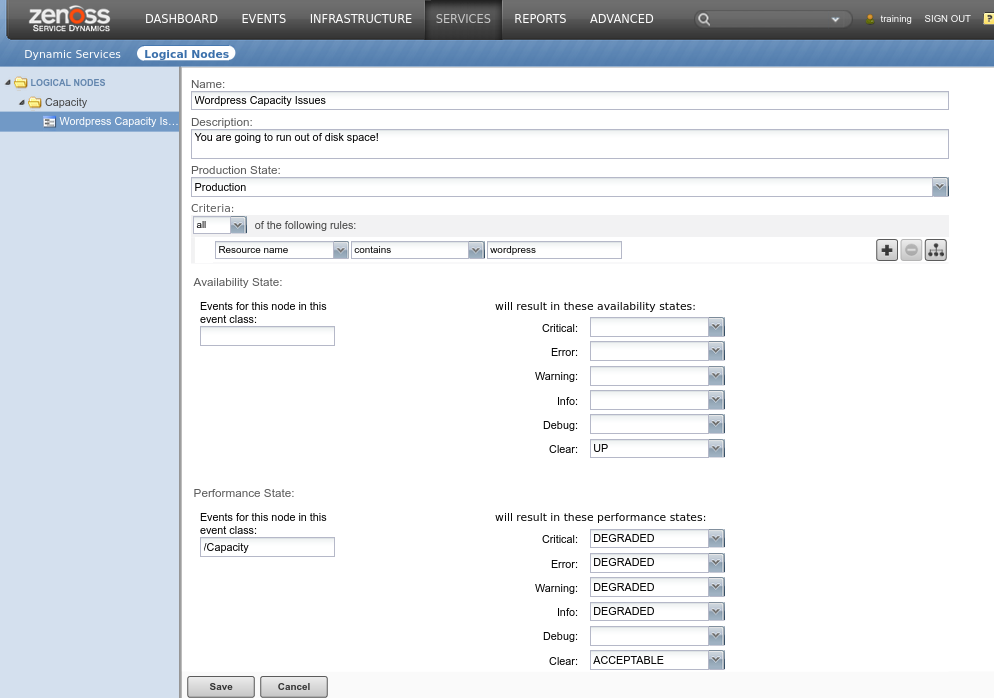
- Logical Nodes are similar to Triggers
- You define the criteria that sets them.
- Often used for events that do not fall under the /Status/ or /Perf/ event classes.
- Hint: Look at Event Classes to see all of the classes that are not /Status/ and /Perf/
- Example: Event class /Capacity/ for a Predictive Threshold event for a hard disk.
- When setting the Availability or Performance states, use the class (Availability or Performance) the event would fall under.
- In the example above, running out of disk space would eventually become a /Perf/ event.
- This can be thought of as mapping non-/Status/ and non-/Perf/ events to /Status/ or /Perf/
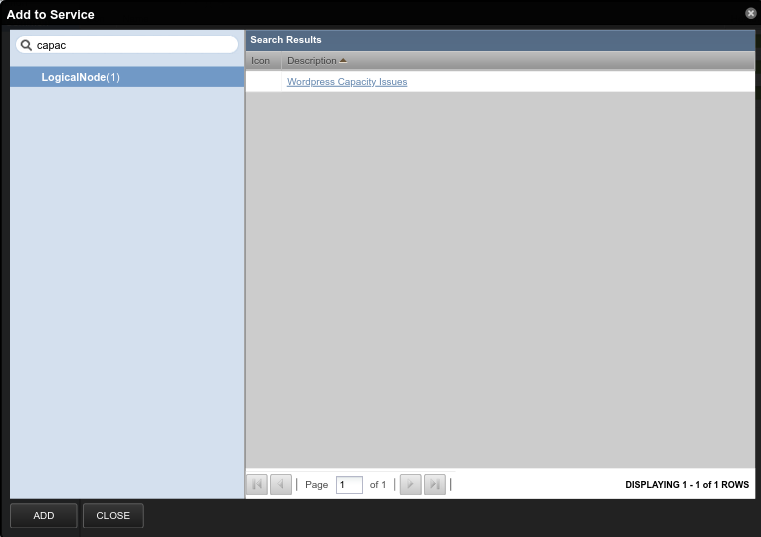
- These can then be added as Members to any Dynamic Service
Service Policies
- By default, all Dynamic Services fall under the Default Service Policy
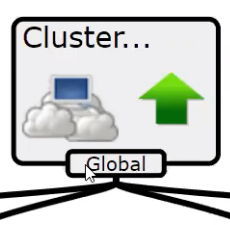
- Global Policies apply to all nodes above the affected node
- Contextual Policies apply to ONLY the Parent node and are not propagated up.
Service Policies Overview
- Collection of State Triggers. The conditions under which the state of a Service or Member element changes.
- Example:
- Critical events cause the Dynamic Services state to be critical…
- Don’t mark degraded unless 50% or more of (Member Set) are degraded
- Example:
- Applied to a service or any of its elements
- Assist in root cause identification
- Provide multiple availability and performance states
- Provide event storm filtering, roll-up and windowing
- Can be applied globally or contextually
- State of impacting elements rolled up into state of impacted element, worst resulting state takes precedence.
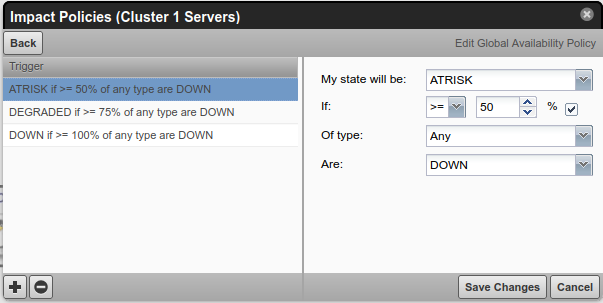
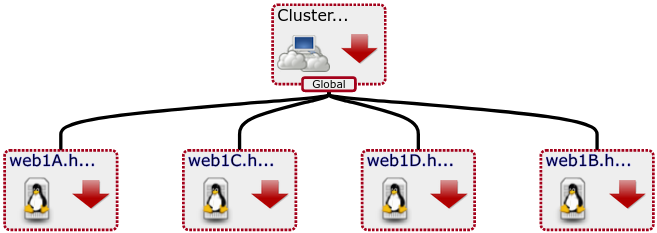
How to Configure a Service Policy: Cluster Example
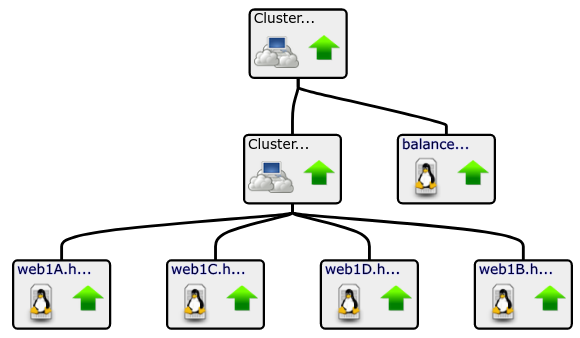
- Cluster 1 Servers > Impact View
- Ensure Aspect = Availability
- Cluster 1 Servers > Right Click > Edit Impact Policies
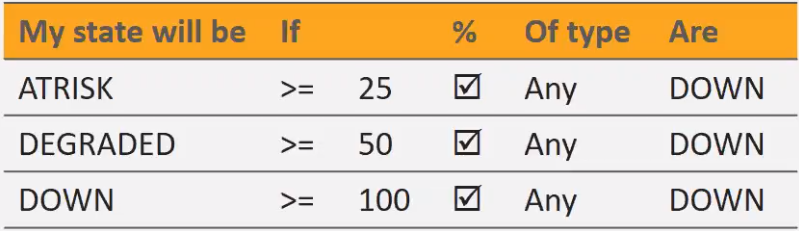
Policy Applied
Events Applied
25% of servers down = No Change
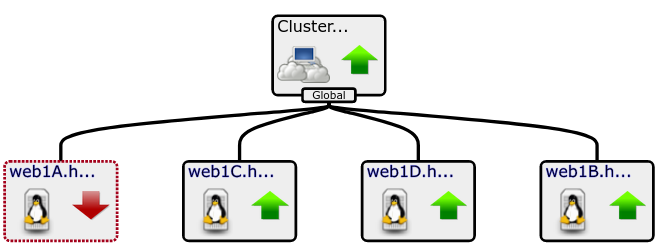
50% of servers down = At Risk
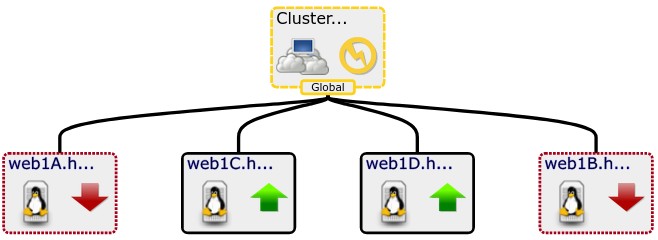
75% of servers down = Degraded
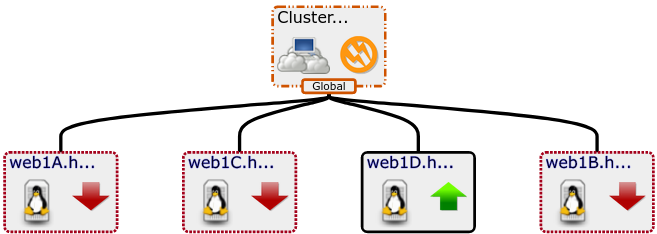
100% of servers down = Down
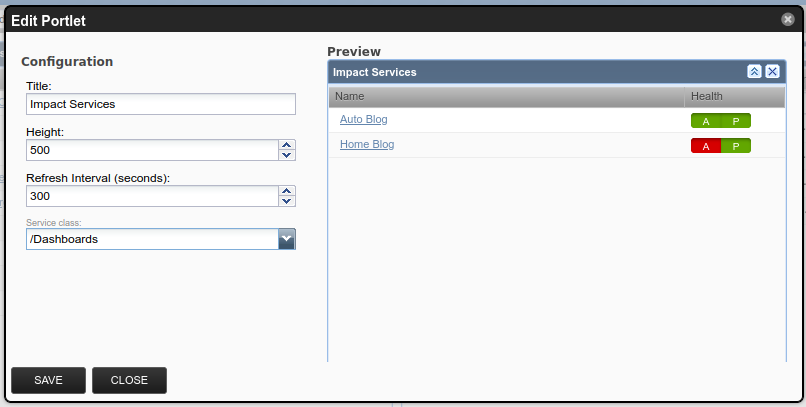
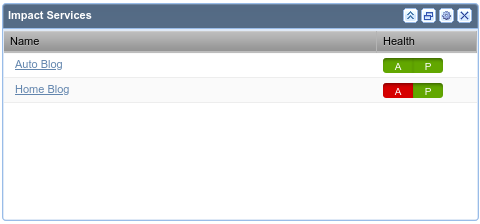
Dashboard Portlet
- Quick view of Dynamic Services’ States
- Can be narrowed down by selecting an Organizer
Edit View
Dashboard View
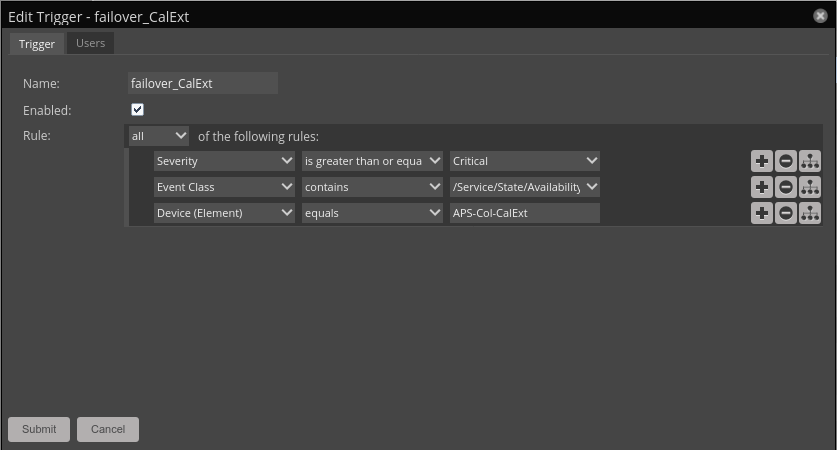
Impact Triggers and Notifications
Triggers
- Triggers can test for events in the Service event class
- One use case for this are Atos Collector Failovers
- When all delegate hosts in a collector are down, a trigger enables a Command notification that runs a script to move all devices to the backup collector.
Notifications
Notification type: SNMP Trap – Impact
- Impact also includes a new Impact MIB
- These notifications will send SNMP Traps that can be decoded with this MIB
- Usage is very rare, but available
Tips and Tricks
Add Devices by Device Organizer
- If you have automation that automatically adds/creates VMs that also adds them to Zenoss Monitoring and assigns them to a Device Organizer (Example: Systems > Clusters > Web), you can simply add the Organizer as a Member of a Dynamic Service.
- This prevents the need to continually add/remove devices manually.
Best Practices
- Create reusable Dynamic Services often.